


WHAT IS VIO DATA
The Real-World Vehicle Population Behind Every Decision
Vehicles in Operation (VIO) data represents the actual population of vehicles on the road today, broken down by year, make, model, and configuration. Instead of guessing which vehicles your parts fit or how much demand exists in a given segment, VIO data tells you exactly how many vehicles are out there right now.
For the automotive aftermarket, VIO is the difference between building a catalog around assumptions and building one around evidence. It shapes what you stock, what you catalog, where you expand, and which products deserve priority.
Why It Matters
VIO data underpins coverage planning, kit development, territory stocking, and gap identification. Every DataPoint tool that touches catalog or market strategy is built to work with VIO at its core, so decisions are grounded in what customers actually drive, not what a catalog assumes they drive.

VIO REPORTING & ANALYSIS
A Full Suite of VIO-Driven Reporting Tools
Each of these reporting tools draws on VIO data to answer a different question about your catalog and your market.
Coverage Reporting
Coverage reporting shows how well your catalog maps to the vehicle population. It lives inside Clarity rather than as a standalone tool, so it's available there alongside the rest of your catalog analytics.

SWEET SPOT REPORTING
Finding the Model Years Worth Stocking
Sweet Spot Reporting plots every fitment by model year and VIO, with bubble size representing units sold, to show where vehicle population and real demand overlap. A configurable launch threshold marks the point where VIO alone justifies carrying a part, so fitments that clear it stand out from ones that don't.
The result is a defined range of model years, the "sweet spot", that a buyer can point to when deciding which fitments deserve shelf space and which are still building toward it.
.png)

VIO HOLES REPORTS
Surfacing Coverage Gaps Worth Researching
A VIO Holes Report cross-references every vehicle configuration, by make, model, year, and engine, against your existing part data to flag configurations that carry real VIO but have no part number assigned yet.
Rather than treating every unmatched configuration the same, the report ranks them by how much VIO sits behind each one, so research and cataloging effort goes toward the gaps with the vehicle population to justify closing them first.


BUYER'S GUIDES
VIO Built Directly Into Part-Level Data
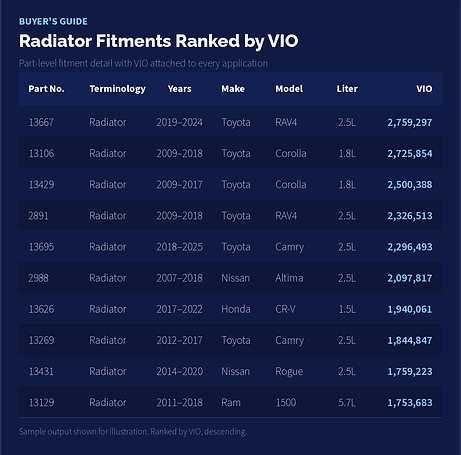
A Buyer's Guide pairs each part number with its full fitment detail, year range, make, model, and engine, and attaches the VIO for every fitment that part covers. Instead of a generic application list, buyers see exactly how many vehicles on the road each part actually serves.
That makes it straightforward to compare parts on real demand rather than fitment count alone, since a part covering fewer, higher-VIO vehicles can matter more than one that fits a longer but lower-volume list.
CONNECTED ACROSS DATAPOINT
How VIO Data Powers Every DPI Tool
VIO isn't a standalone report. It's the shared data layer that runs underneath the rest of the DataPoint platform, so every tool is working from the same real-world picture of the vehicle population.
